By Professor Ravi Batra
There is a well-known Chinese proverb: May you live in interesting times. With the onslaught of coronavirus in 2019, and its continuation in some form as late as 2023, our times are indeed interesting, nay nerve racking. Add to the mayhem of the virus, the unprecedented war between Russia and Ukraine, and the almost non-stop destructive weather-related events all over the world such as tornadoes, hurricanes, cyclones, snow storms, and you start wondering about the Chinese maxim: are these interesting times supposed to be good or bad.

Southern Methodist University, Dallas, Texas
Whether good or bad, history shows revolutions occur at such extraordinary moments. According to the law of social cycles, pioneered by my late teacher Shri Prabhat Ranjan Sarkar, the era dominated by the wealthy, has always ended in a social revolution. Society is so polarized at such a juncture that the only way to resolve that polarization is a full-fledged revolt among the poverty-stricken masses.1
This is how feudalism, the previous era of Western Society, ended. As a matter of fact, there are several similarities between the feudal age and the era of monopoly capitalism, the current system of production in the West. Feudalism lasted roughly from the 10th century to the 15th. This long period of history at first saw a major rise in living standards because of new technology and improving productivity, and Western economies grew in spite of almost a persistent state of warfare among feudal landlords. Laborers, known as the serfs, who were virtual slaves of these landlords also prospered and even won some freedoms from oppressive work in a movement called commutation.
But then came Black Plague which, much like the modern-day coronavirus, decimated the population and reduced the supply of labor. The labor shortage sharply hurt farm output, increased farm prices, generated poverty, and created a highly polarized society. These were also what the Chinese call interesting times. Eventually things became horrendous and the only way out of this impasse was a series of peasant revolts that dethroned feudalism.
Current State of Society
The last days of feudalism are somewhat reminiscent of the current state of monopoly capitalism, especially the United States. American society has been increasingly polarized, mainly after the presidential election in 2020 and congressional elections in 2022. With former President Trump’s indictment in April 2023, polarization grew by leaps and bounds. Furthermore, Poverty and wealth disparity have been scaling to new heights for a long time; in fact, since 1973 real wages have been sinking for a vast number of workers. Moreover, daily shooting incidents are increasingly common, which remind you of petty feudal warfare, while many people continue to insist on preserving their gun rights. A six-year-old boy shot a teacher in his school. On top of all, a new menace has emerged since early 2021—rising prices.
Nowadays, economists, especially the Federal Reserve, consider up to a 2 percent rise in the consumer price index (CPI) a normal state of affairs, something that is just natural to monopoly capitalism, which consists of large firms controlling their prices and wages. Apple, Microsoft, Walmart, Pfizer, and Exxon among others are examples of such companies. These behemoths are not pure monopolies but they still exercise considerable influence over prices they charge consumers and wages they pay to their workers. So economists consider a 2 percent rate of inflation a natural phenomenon for modern-day capitalism.
After May 2021, however, the CPI began to rise at a faster rate, as shown by Figure 1, and crested at 9 percent in June 2022, which was the highest rate of inflation since 1981 and way above the tolerable rate. That woke up the economic profession. Ever since the 1970s, the US has adopted a culture of deficit financing, whereby a government budget shortfall is financed by money creation. It became clear in 2022 that the twin policy of giant federal budget deficits and high money growth that financed them had a major defect. Since then, inflation has eased somewhat but not completely. We will come back to this question later.
Figure 1: The Inflation Rate from April 2018 to April 2023
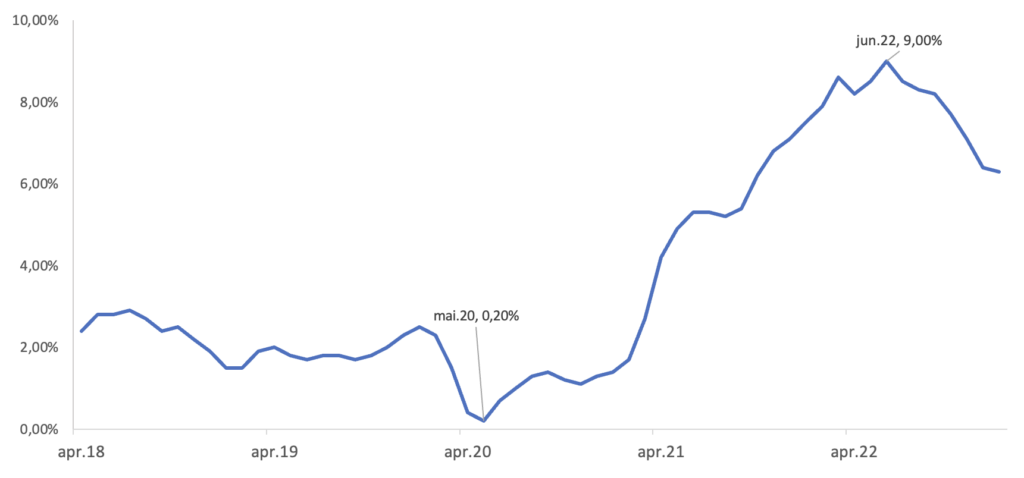
It is noteworthy that until May 2020, the CPI had been rising close to its natural rate of 2 percent. This is displayed in Figure 1.
The Cycle of Inflation
Prior to 1940 the CPI went up and down depending on the strength of the economy as well as the state of politics. During periods of war, prices would rise but then come down soon after the war. So essentially the CPI was the same between 1820 to 1940. Since 1940, however, prices have generally risen every year.2 In spite of this, the US economy has been subject to a regular cycle of inflation. This cycle, believe it or not, began in the 1750s, ever since the data appeared, even prior to American independence in 1776.
Historical statistics about prices started with the computation of WPI, which stands for the wholesale price index and is a measure of the average prices received by producers of commodities. So early inflation figures are provided not by CPI but WPI. This information is captured by Figure 2.
Figure 2: The Long-Run Cycle of WPI Inflation in the United States
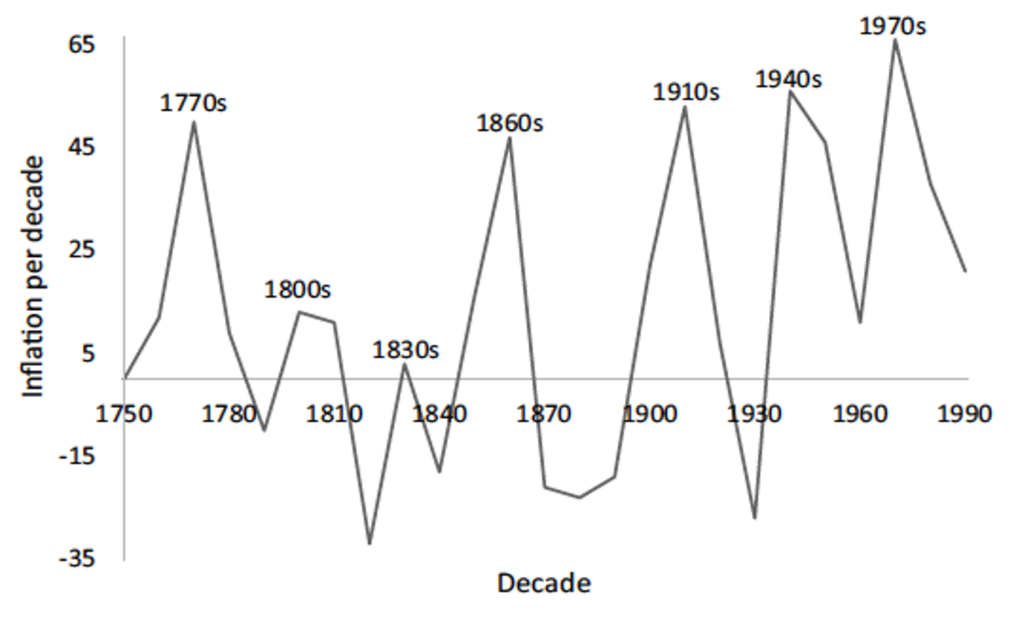
The data on WPI go as far back as the mid-18th century. When studying an economy over long time, it is customary to divide the time period into decades. The next step is to obtain the average WPI per decade, and then compute the decennial rate of inflation, or the inflation rate occurring over a 10-year period. When you plot these data, you obtain a graph such as that displayed in Figure 2. Clearly, in the long run inflation in America has moved through a cycle.
The character of inflation in the United States has changed drastically over time. As stated above, every burst of a price increase in the past met with an almost equal burst of a price decrease. But following 1940, prices have generally moved in only one direction — upward. Yet the long run nature of the inflation rate, which is a percentage change in a price index, has remained the same
The behavior of WPI and CPI in the 19th and early 20th century was very different from that in the late 20th century. However, with the cycle of inflation, starting as early as the 1750s, there is no such discrepancy. The cycle, which is described by the price rise per decade, not just the average price like the CPI or the WPI, follows an oscillating path all through American history and reveals an amazing phenomenon. Except for the post-Civil War period, Figure 2 displays an incredible track, namely that at least over the past 200 years the rate of inflation reached a peak every third decade and then usually declined over the next two. As far as inflation is concerned there is no discontinuity between the 18th and 19th centuries on one side and the 20th century on the other.
Inflation first reaches a peak in the 1770s in Figure 2, then decreases over the next two decades and peaks again in the 1800s. It declines over the following two decades, cresting in the 1830s. This time the rate of inflation declines for only one decade, but still the subsequent peak appears 30 years later in the 1860s. Thus, the first four peaks of the cycle have followed an exact three-decade path.
Following the 1860s, the cycle hits an impasse, but begins anew with the 1880s, because within two decades another peak appears in the 1910s, which is the first inflationary peak of the 20th century. Three decades later the cycle crests in the 1940s, and then again in the 1970s. In the 1980s the rates of inflation plunge, just as the cycle prophecies.
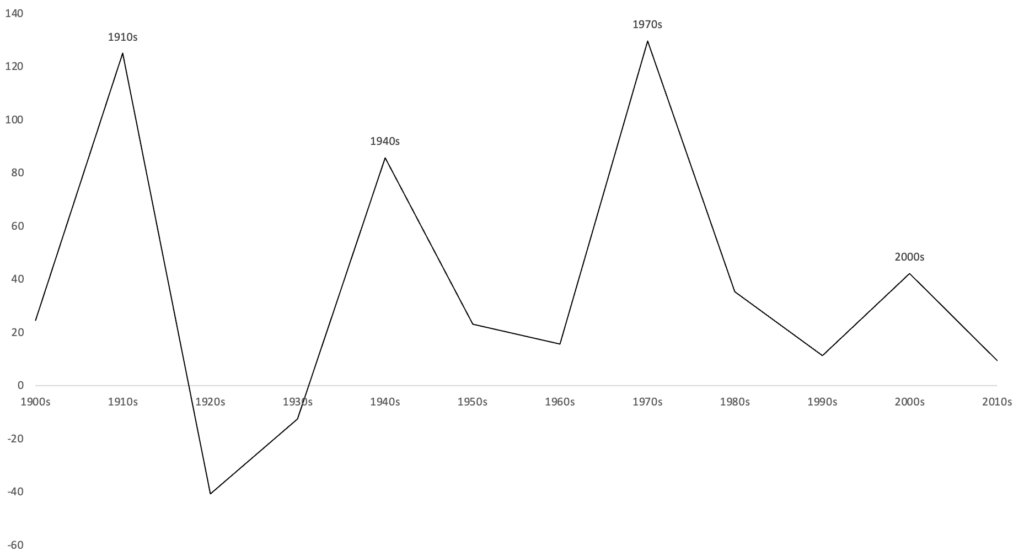
From 1913 on, the Bureau of Labor Statistics (BLS) devised another measure of inflation, which is called the PPI or producer price index. This one is similar to WPI but it includes the prices received by producers of services and commodities. Hence it is a broader measure than the WPI. Figure 3 tracks the path of the PPI from 1900 all the way to 2010s, and not surprisingly its message is the same as that of Figure 2, namely inflation reaches a peak every third decade. Note that since the PPI data starts from 1913, I have used the WPI data for the decade of 1900s.
Figure 3: The Cycle of PPI Inflation in the United States Since the 20th Century
The Long Run Cycle of Money Growth
What causes inflation? Prices rise when demand for goods and services increases faster than their supply. Since inflation is a sustained jump in prices over several years, then demand has to keep growing faster than supply for some time. The availability of money in the economy plays a crucial role in this connection. Thus, parallel to the cycle of inflation exists another neat arrangement of history, namely the long-run cycle of money growth. In other words, excessive demand over supply fueled by money creation brings about a price spiral. So ever since the 1770s, as far back as the US data go, every third decade has also been a peak decade of money growth, with the singular exception after the 1860s, owing to the Civil War. There have to be too many dollars chasing too few goods for an enduring rise in the cost of living. It is just that simple. As you can see from Figure 4, this is precisely what has happened.
Figure 4: The Long-Run Cycle of Money Growth in the United States: 1750s–2010s
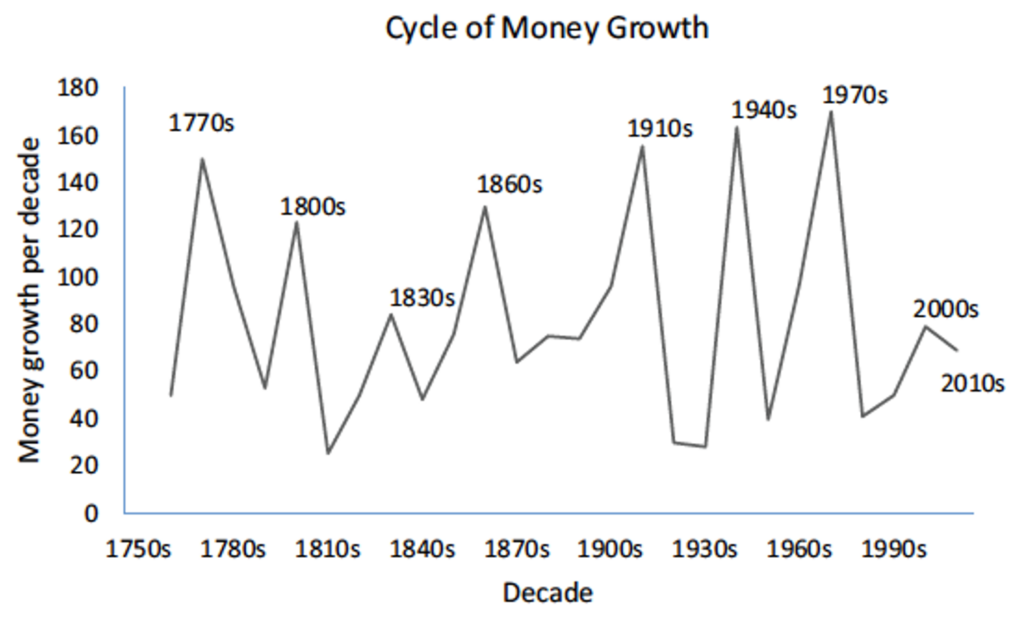
The cycle of money growth is easier to obtain than the cycle of inflation. Estimates of money supply come from Friedman and Schwarz,3 going as far back as the birth of the American nation in 1776. The data used are for every 10th year. A simple transformation of these observations into rates of change per decade then yields a vivid cycle.
The first peak of the cycle starts with the 1770s, which saw the birth of the American Revolution and an extraordinary use of the money pump to finance it. As you can see, all the peaks of the money cycle are also the peaks of the cycle of inflation in Figure 2. Similarly, the Civil War also disrupted both cycles.
The nation took about 20 years to recuperate, but once the economy’s recovery was complete by the early 1880s, both cycles dutifully resumed their rhythmical course. Within two decades money growth crested in the 1910s, then in the 1940s, followed again by the 1970s, and so on. To no one’s surprise, in the 1980s and 1990s, money growth fell, and then surged again in the 2000s.
Money growth also peaked in the 2000s as is clear from Figure 3, and not surprisingly, it can be easily shown that both WPI inflation and PPI inflation also peaked in that decade. This has been a remarkable feature of the US economy, but not of other economies. But nowadays the US economy dominates all others in the globe. So American inflation also impacts the rest of the world.
“Every good thing eventually becomes a dogma in the hands of self-serving economists.”
Lessons of the Money Cycle
The money cycle has profound lessons for US history. First, money supply or wealth is the nucleus for most American people and institutions. Just as feudalism, capitalism is also in the age of acquisitors, where wealth rules the roost. Second, both of the oldest cycles have similar peaks and valleys, and most of the peaks occur around major wars. The peak of 1770s is linked to the war for American independence that started in 1776 and lasted through that decade. War spending creates excess demand as well as the need for money creation, so money growth and prices jump at a fast pace. Is there a war around the peak of 1800s? Yes, there is: the Napoleonic Wars occurring in Europe but affecting the US economy all through the decade of 1800 to 1810, when US exports to Europe jumped sharply.
Both Britain and France met their domestic needs of food and cotton from imports from the United States, which in turn caused the American money growth and prices to soar. There was no significant conflict in the 1830s, and this may explain why both money growth and inflation register the lowest peak in the two cycles. Next comes the bloodiest conflict in America’s annals: the Civil War of the 1860s. Here peaks of both cycles were the highest in the 19th century. However, the war all but destroyed the US economy, demolishing its normal pattern. This shock was so great that both cycles were disrupted. But the United States was resilient, as were the cycles. Within two decades, both cycles made a comeback. After 1880s, it took another two decades for both peaks to recur. Both the money growth cycle and the inflation cycle returned in the 1910s. This was another war decade, as was the decade of the 1940s.
The next peak in terms of both tracks arose in the 1970s, where Keynesian economics is primarily responsible for them, although the short, six-day war between the Arabs and Israel was the main trigger for the inflationary 1970s. While the OPEC’s oil embargo in 1973 resulted from this conflict, Keynesian theories caused the giant increase in the growth of money, thus producing a sustained jump in inflation. OPEC stands for the organization of petroleum exporting countries and even now it exercises a major influence on the price of oil.
Keynesian Economics
In modern economics there are basically two schools of thought—classical and Keynesian. Until the Great Depression in 1929, the classical school dominated the thinking of most economists. Since then, it is the Keynesian school, along with its offshoots, that has been predominant.
The classical doctrine in its purest form derives from Adam Smith, the celebrated author of The Wealth of Nations, which was published in the same year the 13 American colonies declared their independence from England. The classical school is also called a non-interventionist school while the Keynesian school is known as an interventionist school.
Keynes wrote his book, The General Theory of Employment, Interest and Money, in 1936, when the depression was in full swing. Earlier he had spent some time as an IAS officer in India, where apparently, he came across an ancient text authored by Kautilya, The Science of Wealth, which reminds you of The Wealth of Nations.
Kautilya may be considered the first economist in ancient history. He was born at a time when India was in its own age of acquisitors, much like feudalism and capitalism. He was not only a celebrated scholar but also a great humanitarian. He was contemporary to Alexander the Great, whose greatness lies in setting villages and cities of subjugated nations to fire.
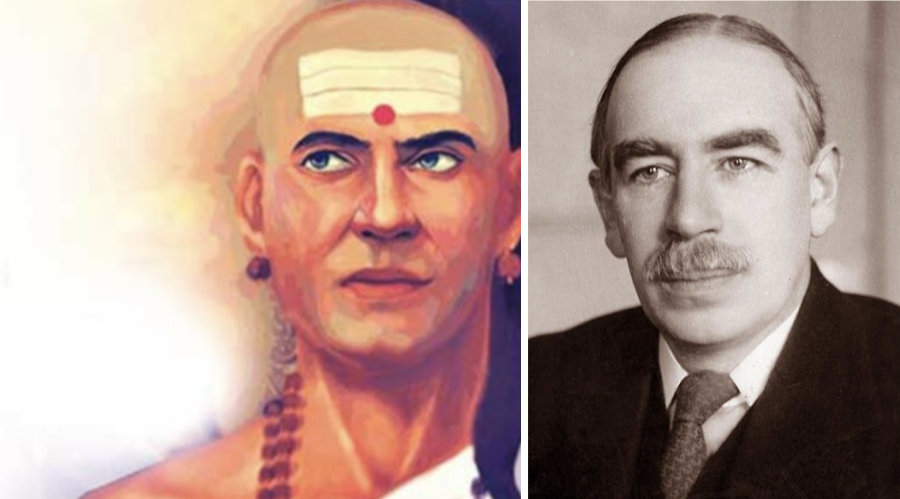
Buddhist literature provides us a lengthy account of Kautilya’s revolutionary activities. He along with a warrior named Chandragupta Maurya rebelled against his king Dhananada, who ruled over Magdhan empire, which was the largest in India at the time. Dhananda’s name means someone who enjoys wealth. When the king, greedy and a tyrant, was dethroned through a revolution of poverty-stricken workers, people heaved a sigh of relief. Chandragupta appointed Kautilya as his prime minister, who deftly managed the economy and quickly restored imperial prosperity. The rebellious author went on to record his experiences in his book called, Arthshastra, which, as mentioned above, means the science of wealth. Here are some interesting excerpts:4
“In the happiness of his subjects lies the king’s happiness, in their welfare his welfare … Hence the king shall be ever active in the management of the economy … A king can achieve the desired objectives and an abundance of riches by undertaking economic activity.”
It appears that Keynes was inspired by Kautilya’s thought. When he saw millions of people around the world starving and destitute during the decade long depression, he also wanted the government to do something for the suffering humanity. He recommended ex-pansionary fiscal policy which required the government to expand the budget deficit. He even met President Roosevelt about his proposal, but the president paid no heed. Classical doctrine held that the state should not intervene in affairs of the economy, and the president held steadfast to that belief. While he didn’t go so far as to intervene directly through fiscal expansion, it must be said in fairness that he introduced some much-needed reforms related to the minimum wage, social security, etc.
By contrast, it was Adolf Hitler who adopted the Keynesian philosophy of direct job creation by the government, and unemployment quickly disappeared in Germany. But Hitler’s acceptance of Keynes’ ideas had the opposite effect. Hitler was a pariah in the eyes of Britain, France and the United States, the trio of allied states, and Keynesian economics went nowhere.
However, once Hitler started the second world war in 1939, war spending in allied states had to jump, and budget deficits ballooned even among allies. It was simply a matter of survival. Lo and behold, unemployment, as high as 17 percent of the labor force in America in 1940, fell to just 3 percent by 1943. Keynesian economics became popular at that time and has been popular ever since.
Every good thing eventually becomes a dogma in the hands of self-serving economists. Keynes had recommended budget deficits only to fight a depression or a recession, and a budget surplus once full employment has been achieved, which in practice means an unemployment rate of less than 4 percent; this is because there is always some joblessness no matter how good the economy is.
Now you will be able to see how neo-Keynesian economics, actually neo-Keynesian dogma, generated the inflationary peak of the 1970s. Inflation occurs when demand goes up faster than supply, or when supply falls faster than demand. When the Arab countries imposed an oil embargo as a result of their war with Israel in 1973, the oil price shot up and increased fourfold. The result was a huge jump in the cost of producing goods and services. America at the time was a gas guzzler and energy inefficient. This caused a big fall in supply and with supply trailing demand, prices had to rise.
Soon the embargo was lifted but the oil price did not decline. Unemployment was beginning to rise, and neo-Keynesian economists that formulated economic policy continued to raise the budget deficit, and the Federal Reserve financed it with money creation. So it was that both money growth and inflation peaked in the 1970s. In fact, these were the highest peaks in the 20th century.
Next, we examine the rates of inflation in the 2000s, where the main trigger was the international price of oil that rose to an all-time high of $147 per barrel. Here both the WPI and PPI reached a peak as revealed by Figures 2 and 3, but the CPI inflation did not. The CPI inflation rate was more or less the same in the 1990s and 2000s. However, the Great Recession started in 2008 along with millions of layoffs, and the rate of unemployment shot up to 10 percent. Consumer demand plummeted, and even then, the CPI inflation did not decline.
During the 1970s, the neo-Keynesian dogma was renamed as the Philipps curve, which holds that inflation and unemployment are negatively related; in other words, if inflation rises joblessness declines, and conversely. The modern 2 percent inflation rule is the by-product of this Philipps curve.
The Behavior of the Fed
The Federal Reserve System, also known as the Fed, was established in 1914 in order to regulate the supply of money. Pryor to Fed creation, money supply responded to conditions in the money market, which primarily deals with printed money as well as deposits held by commercial banks. One would think that the creation of the Fed at least tamed the money growth cycle, possibly eliminating it. Instead, the opposite happened, because fluctuations in money growth actually amplified in the post-1914 period till the 1970s. This is what appears from Figure 4. However, thereafter the fluctuations did decline, but the cycle remained intact.
The Last Year of a Decade
The long-term cycles that we have analyzed are simply the outstanding features of American economy. No other nation displays them, which perhaps is not a surprise. As stated above, the US is the nerve center of monopoly capitalism with the largest economy in the world.
Now we explore another feature of world history that is also difficult to explain, namely the events of the last year of a decade. Specifically, ever since the 1920s, a decade’s final year displays an event that has global repercussions for the coming decade. These repercussions may be good or bad, although they have been mostly destructive.
The last year of the 1920s was 1929 and that marks the beginning of the Great Depression. Then came 1939 with the start of WWII. 1949 was the year of communist revolution in China, as was 1959, the year of another communist revolution, this time in Cuba.
Next is the year 1969, which marks the birth of the great inflation that pulverized the world in the 1970s. But 1969 was also a wonderful year when two Americans, Neil Armstrong and Buzz Aldrin, landed their spacecraft on the moon.
What else can happen in a decade’s last year? How about the revolution in Iran that occurred in 1979 when the Shah of Iran was overthrown by a priest named Ayatollah Khomeini. What about 1989. The Berlin Wall fell on November 9, 1989 and unleashed a series of events that eventually unified East and West Germany.
What about 1999? This is the year when President Bill Clinton was tried and then cleared from all charges of impeachment by the US Senate. He was only the second American president who was impeached, the first being Andrew Johnson in 1868.
What about 2009? That year someone named Barack Obama, a black politician, became the US president, an unthinkable event until that time. Finally, we come to 2019. This is the year of coronavirus that initially took birth in China and then spread around the world.
From 1929 to 2019 is almost one century in which the last year of the decade witnessed an unusual episode that had major consequences for our planet. In fact, two such events were foreseen by me:5 The dethronement of the shah of Iran by the Iranian priesthood and the birth of a Black Plague in the form of coronavirus. What can we say about 2029? This is what we turn to next.
Conclusions
We can now put all our strands together and see what we should expect for the decade of the 2020s. The long run cycles reveal that both money growth and inflation have peaked together in US history but there was one exception that occurred in the post-Civil War period. The last inflationary period was the decade of 2000s, which means sustained inflation is not supposed to return until the 2030s. Then what about the jump in prices that we have witnessed from 2021 to 2023? It merely suggests that this price spiral is temporary, resulting from a pandemic that caused millions of deaths around the world and the consequent shortage of labor. In a global economy the labor shortage led to a rise in wages as well as transportation costs, disrupting international trade. With supplies falling relative to demand, prices had to rise. In this scenario, the rate of inflation will fall by the end of 2023 or soon thereafter, and then return to the natural rate of 2 percent per year.
Another scenario is suggested by Sarkar’s law of social cycles that has never failed in 5000 years of recorded history. After all, monopoly capitalism, or the age of acquisitors has to end in a social revolution of masses that have been impoverished by unprecedented disparity of wealth. This is what happened to feudalism in the West in the 15th century and more recently in China where Mao Zedong brought an end to the Chinese variety of feudalism in a bloody war in 1949.
Since another war was started by Russia in February 2022 this outcome cannot be ruled out. Russia-Ukraine conflict along with American and NATO’s strong military support to Ukraine suggests that the US age of acquisitors will end in this decade, possibly by 2029, which is the last year of the 2020s.6 This event will usher in a new golden age as monopoly capitalism ends and mass capitalism or economic democracy begins.7 Such is the dictum of the law of social cycles.
Russia’s invasion of Ukraine has opened yet another possibility, which was unimaginable until now. With the United States and European Union providing generous military aid to the gutsy people of Ukraine, the ongoing European conflict could escalate into a full-fledged nuclear war, where victory will be meaningless for both sides. History, past and present, will then be no guide to our future. Only Dharma, the law of righteous conduct, will win, and those who genuinely love God will survive.
Interview with Dr. Ravi Batra: Let There be More and More Competition
Endnotes
- P.R. Sarkar, Human Society, II, Ananda Marga Press, Denver, 1967.U.S.
- Department of Commerce, Historical Statistics of the United States, 1975.
- Milton Friedman and Anna Schwartz, A Monetary History of the United States, 1867-1960, Princeton University Press, 1963. Also see Ravi Batra, Common Sense Macroeconomics, World Scientific Publishing, London, 2020.
- For an excellent introduction to Kautilya’s economics, see Navin Doshi, Economics and Nature: Essays in Balance, Complementarity and Harmony, Nalanda International, Los Angeles, 2012.
- See: Ravi Batra, The New Golden Age, Palgrave Macmillan, New York, 2007, pp. 79 and 173.
- Ravi Batra, The Downfall of Capitalism and Communism, Macmillan Press Ltd., London, 1978, republished by Liberty Press in Dallas in 1990. Long wars quite often dictate the social cycle.
- Apek Mulay, New Macroeconomics, Business Expert Press, New York, 2018. Also see: Ravi Batra, Common Sense Macroeconomics, World Scientific Publishing, London, 2020.
Published in Neohumanist Review, Issue 1, September 2023, pp. 48-57.


1 thought on “The Cycle of Inflation and the Price Spiral of the 2020s”